Increase the productivity and transparency of your team
by visually presenting the workload of each team member.
Just Gantt - it can't be easier
Nothing superfluous, just a visualization of the epics' timing with the ability to move epics.
Completed issues are marked with a checkbox.
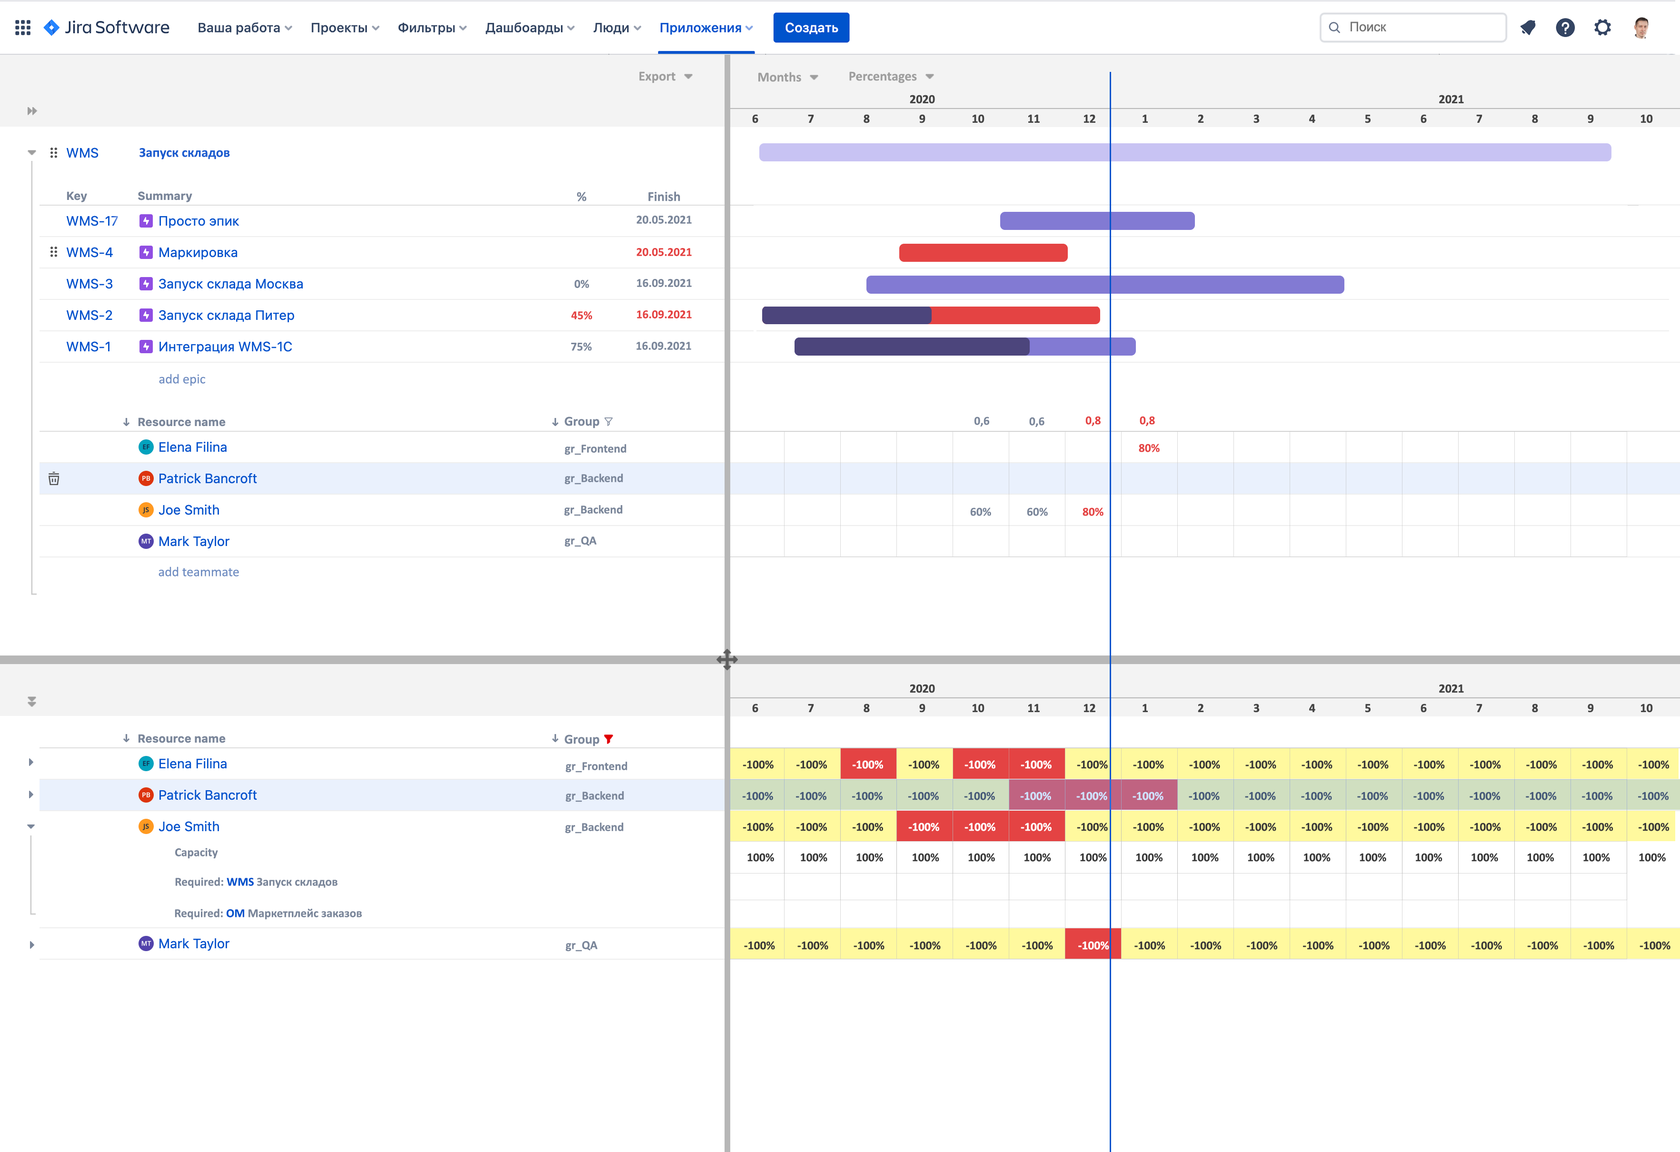
Overdue issues are marked in red. Both in the list and on the Gantt chart diagram.
Need to shift an issue out into the future? Move it back into the past? Just grab it, then drag and drop to update both the start date and due date. Or grab the end of the task to deadlines shift.
Overdue issues are marked in red. Both in the list and on the Gantt chart diagram.
Need to shift an issue out into the future? Move it back into the past? Just grab it, then drag and drop to update both the start date and due date. Or grab the end of the task to deadlines shift.

Manage Resources
A visual representation of the loading of resources involved in several projects. The ability to manage the workload. Any resource overloads will be highlighted.
You can manage the loading of resources immediately on the Gantt chart diagram.
Select a cell, press Enter (or double click on the mouse), and fill the required percentage load value.
Overloaded resources are marked in red.
Select a cell, press Enter (or double click on the mouse), and fill the required percentage load value.
Overloaded resources are marked in red.

You can manage the loading of resources in the Resources planning area.
Select a cell, press Enter (or double click on the mouse), and fill the required percentage load value.
Overloaded resources are marked in red.
Select a cell, press Enter (or double click on the mouse), and fill the required percentage load value.
Overloaded resources are marked in red.

© 2021 GanttRes
Product
- Home
- FAQ
- Pricing
About us
- Company
- Job openings
- Privacy
- Contacts
Help
- FAQ
- Tutorials
- Integration
- To developers